What Is Algorithmic Trading?
Algorithmic trading is a way of operating in financial markets using computer programs to automatically execute orders based on predefined rules and strategies. These algorithms can analyze vast amounts of data, identify market opportunities, and send orders within fractions of a second, reducing human intervention and improving operational efficiency.
Algorithmic trading is used by both large financial institutions and individual traders. It can be applied to a wide range of strategies, from market making to arbitrage, momentum trading, and statistical price forecasting.
From a historical perspective, market fundamentals have not changed significantly over the past few decades. However, the environment in which traders operate today is very different from the markets of the 1990s or early 2000s. Electronic trading has profoundly reshaped this environment, especially through DMA (Direct Market Access), which allows traders to send orders directly to the market via their broker and its platforms or connections.
Other minor inflection points have also shaped the behavior of the main markets targeted by algorithmic trading, such as:
- The 2008 Lehman Brothers crisis
- The 2011 taper tantrum
- The 2017 regime change
We are particularly interested in algorithmic trading because it eliminates the emotional component typical of manual decision-making. This allows for more rigorous risk control and increases the probability of long-term success. Moreover, algorithmic trading offers immense development potential, thanks to ongoing advances in hardware, software, and artificial intelligence—enabling increasingly sophisticated and adaptive strategies.
The Systems Behind Algorithmic Trading
Trading strategies can only be successful if asset prices move in a statistically predictable way—such as trends, ranges, or volatility bursts. If prices follow a purely random path, trading in general cannot yield consistent profits.
Academic research has shown that financial asset prices, on average, move in a pattern very close to Brownian motion. Quantitative finance largely builds upon these assumptions. A classic example is the Black-Scholes formula, as well as the majority of derivative pricing models. However, statistical and econometric models also incorporate trend-following and mean-reverting behavior.
This does not mean that prices never trend or mean-revert—such movements can be seen as market inefficiencies. In fact, market efficiency is not constant, and inefficiencies do exist under certain conditions.
Designing a trading strategy fundamentally means identifying the conditions under which an asset is more likely to trend or mean-revert—or recognizing when the market is too efficient to trade.
Categories of Algorithms
Key Concepts in Developing Trading Systems
There are some basic principles to keep in mind when designing trading systems. These guidelines have been derived through years of effort and trial-and-error by algorithmic traders.
There are three fundamental types of markets:
- Trending
- Volatile
- Ranging (sideways)
The goal is to develop systems that perform well in one type of market while limiting losses in the others. Alternatively, one can build multiple systems for different market phases, starting with a process that identifies the current market condition.
Another important concept is that it’s not necessary to design the entire system at once. You might have an excellent entry signal but no clear exit rule. It’s perfectly acceptable to begin with entries and optimize them before moving on to exits—or even to test exits using random entries.
Types of Trading Systems
Trading systems are often divided into two main categories:
- Trend-following or momentum systems
- Mean-reverting systems
Statistical arbitrage strategies involving multiple instruments often share similarities with mean-reverting approaches, though there are important differences.
In modern quantitative analysis—largely mathematical and econometric—models are generally classified as:
- Momentum models
- Mean-reverting models
Momentum models attempt to “predict” future values using tools like Markov models, regressions, moving averages, Kalman filters, and neural networks. Mean-reverting models work with stationary time series or cointegrated pairs for pair trading or related strategies.
In this introductory phase, our approach is quantitative—since we’re discussing algorithmic trading—but references technical analysis more than econometrics.
Market and System Selection
The first step in developing trading systems is choosing the type of market you want to trade. This decision shapes the kind of system you’ll build. Let’s look at some conditions typically found in each market type and the systems best suited to them.
As noted earlier, there are essentially three market types or phases. Each is characterized by specific price behaviors. All three are tradable, but each requires different rules and systems.
Trading in Trending Markets
Trending markets are characterized by strong, sustained price movements—either upward or downward.
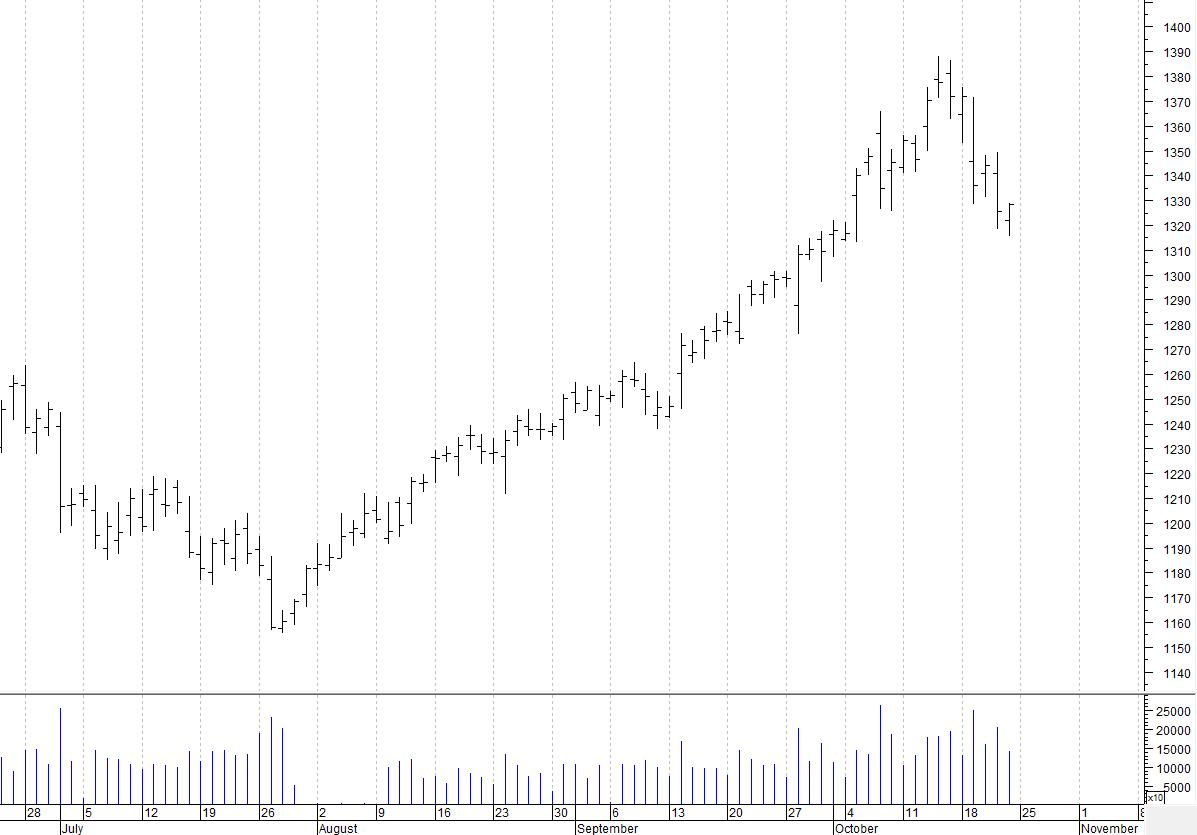
Example: Recent gold uptrend
Systems that thrive in trending markets are designed to capture all major directional moves, ideally without missing any. One simple approach is to always be in the market—either long or short—using stop-and-reverse systems. Another method is to always have stop orders placed above and below the current price, providing protection against false moves.
Good trend-following systems typically have a win rate between 30% and 45% and generate most of their profits from a few long trades. To avoid missing the next major move, it’s essential to limit losses during range-bound phases.
No system is profitable under all market conditions. To generate net profits, losses must be minimized during periods of consolidation.
Characteristics of trend-following systems:
- They earn 80% of their profits from about 20% of trades. This makes them psychologically challenging to follow due to the low win rate (~40%).
- Research shows that markets move sideways approximately 85% of the time. During such periods, systems must control drawdowns.
Despite these challenges, trend-following systems are extremely popular—likely because they offer the potential for large profits. Many traders also find it psychologically rewarding to catch and ride a strong trend.
Trading in Non-directional Markets
A non-directional market is defined by minor price swings—small up and down movements within an overall sideways range.
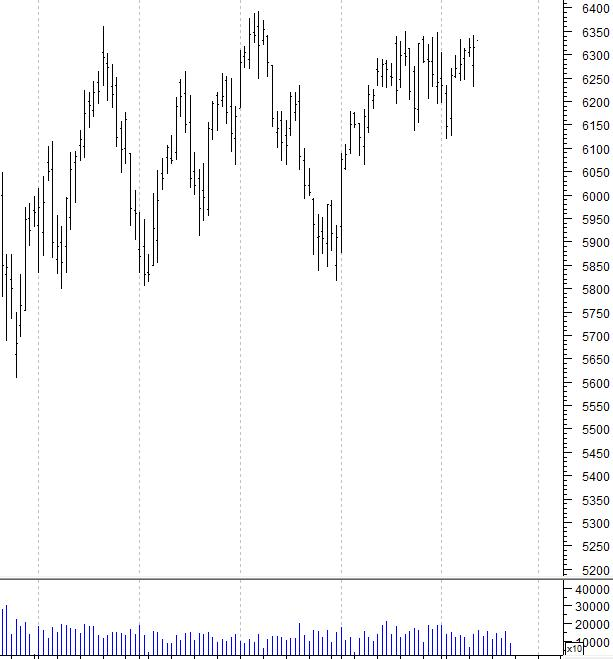
Example: Lateral movement in the DAX futures
Typical systems for non-directional markets include:
- Oscillator-based systems
- Systems that identify support and resistance zones
The central idea is to profit from the oscillations that occur in ranging markets. Since about 85% of market activity is sideways, these systems tend to have a higher win rate.
The strategy is to buy near the lower end of the price range and sell near the upper end, capitalizing on the swing movements typical of congestion phases.
These systems offer the psychological comfort of frequent wins but run the risk of missing substantial profits during strong market moves.
Time Frame Selection
Just as it’s important to analyze price behavior, it’s equally crucial to choose the right time frame. Picking an appropriate time frame is as important as identifying the market phase or selecting a trading system.
This concept is now even more relevant. While we used to distinguish between weekly, daily, or intraday data, we must now also consider high-frequency and ultra-high-frequency data (tick-by-tick).
- Daily Data: Still the most commonly used. Historically dominant in technical analysis, daily charts allow decisions to be made when markets are closed—without the urgency of real-time trading. Ideal for traders with other jobs who can’t monitor markets full-time.
- Weekly Data: Suitable for long-term investors and portfolio managers. Weekly charts imply limited trading frequency. However, this time frame is now less common due to increased market volatility.
- Intraday Data: 5, 10, or 30-minute charts should ideally be built from tick-by-tick data. In practice, many data vendors compress data to reduce transmission and cleanup costs.
With the rise of DMA and extended trading hours, these distinctions matter less. A systematic trader doesn’t need to be glued to a screen but should ensure that all connections and data feeds are functioning correctly.
Final Thoughts and What’s Next
This article is a brief introduction to the broad and complex world of algorithmic trading. It’s designed to offer a starting point for those interested in exploring this field.
In future articles, we’ll explore in detail the various techniques and strategies used in algorithmic trading—covering both theoretical and practical aspects. Each article and strategy example will include complete code in EasyLanguage, C#, and Python.
We’ll also focus on the application of artificial intelligence in algorithmic trading, examining how advanced machine learning tools and predictive models can enhance strategy efficiency and profitability.